About 24/7 Prayer Dublin
About Us
1. We are part of the of the 24-7 prayer movement
2. 24-7 Prayer is an international, interdenominational movement of prayer, mission and justice working in more than half the nations on earth. The movement helps millions of people in thousands of locations to encounter God and engage with the needs of the world.
3. 24-7 Prayer aims is to revive the church and rewire the culture through Prayer Rooms and Boiler Rooms. Please see 24-7prayer.com for more details
As part of the 24-7 prayer family, our aim is to live out the values & practices locally in our city, Dublin. We are connected and work with other Irish expressions of 24-7 Prayer including another boiler room in West Belfast (http://www.24-7prayerireland.com)
Our vision is to see ordinary people’s lives, challenged & changed by encountering the person of Jesus and together, live out His vision for life in our city today.
WE DO THIS IN 2 WAYS:
Through resourcing & encouraging prayer initiatives that impact our beautiful city.
Through local communities that gather around practices of prayer, justice & mercy, hospitality, creativity, and learning.
OUR VALUES
- Our beliefs are best expressed in the life of Jesus, depicted in the gospels, and in the words of the Nicene Creed, shared by all his followers for more than 1500 years.
- Our vision is driven by 3 core Christian priorities and 6 radical practices
OUR 3 PRIORITIES
- We seek to be authentic: TRUE to Jesus.
- We seek to be relational: KIND to others.
- We seek to be missional: LOYAL to the gospel.
These priorities aren’t new. They come directly from Christ’s Great Commandment (to love God and love our neighbour – Luke 10:27) and his Great Commission (to go make disciples – Matthew 28:19)
OUR 6 PRACTICES
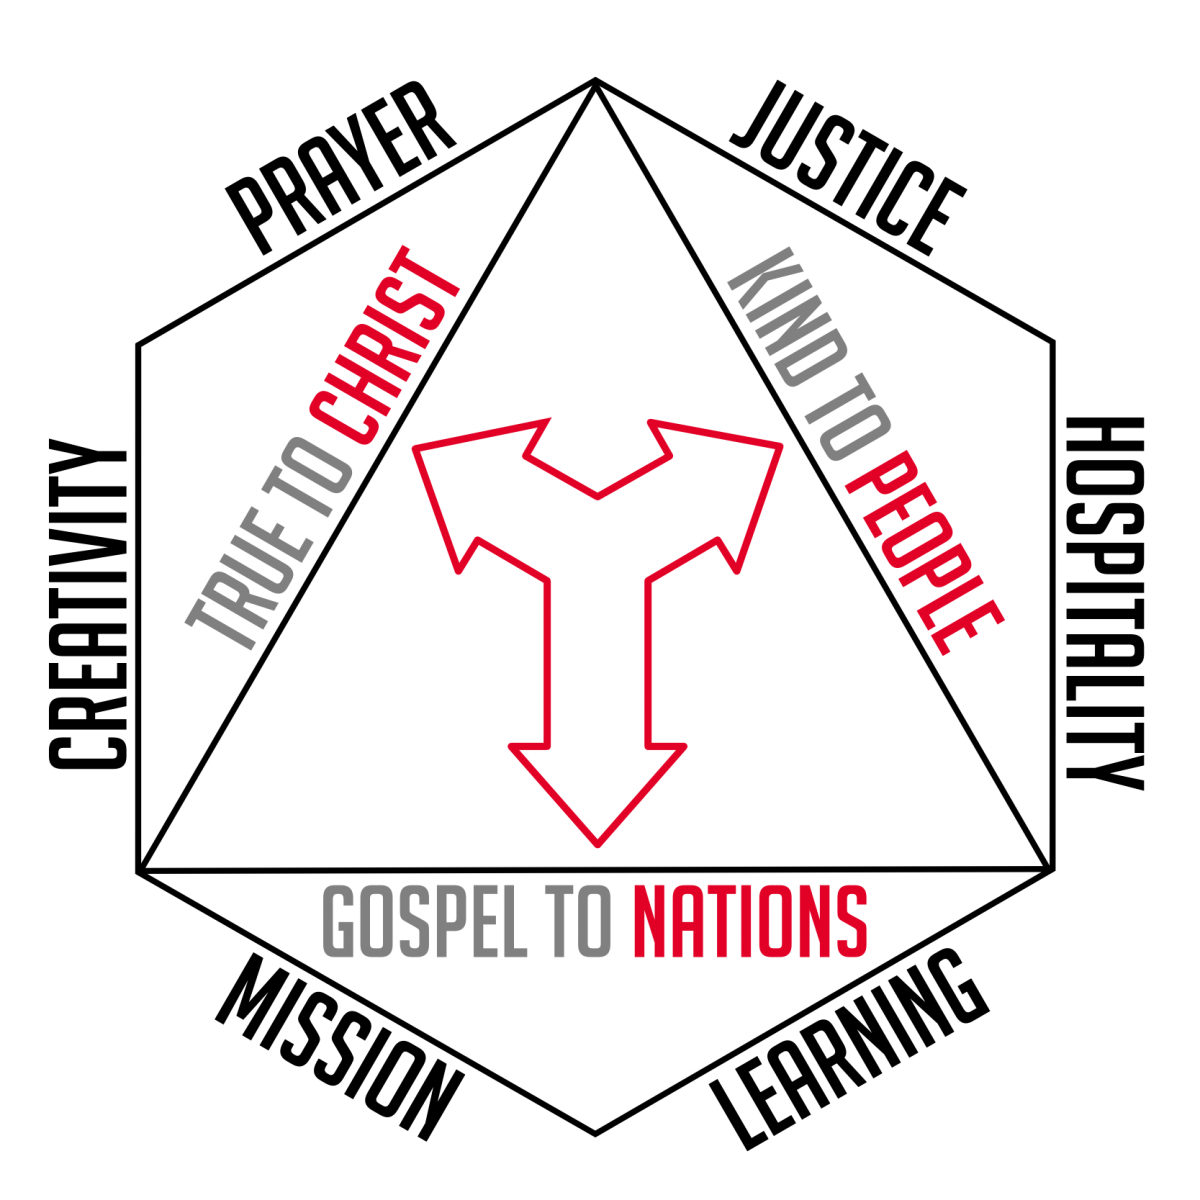
We express each one of these three priorities in two practical ways:
We seek to be TRUE to Jesus through:
- PRAYER & WORSHIP ~ because encounters with God can change everything
- CREATIVITY ~ because the Creator really is worth celebrating
We seek to be KIND to others through:
- HOSPITALITY ~ because God has welcomed us into his family with lavish generosity
- JUSTICE & MERCY ~ because we care passionately about those on the edges
We seek to be LOYAL to the gospel through:
- MISSION ~ because the gospel is good news for every single person on the planet
- LEARNING ~ because Jesus is still in the disciple-making business